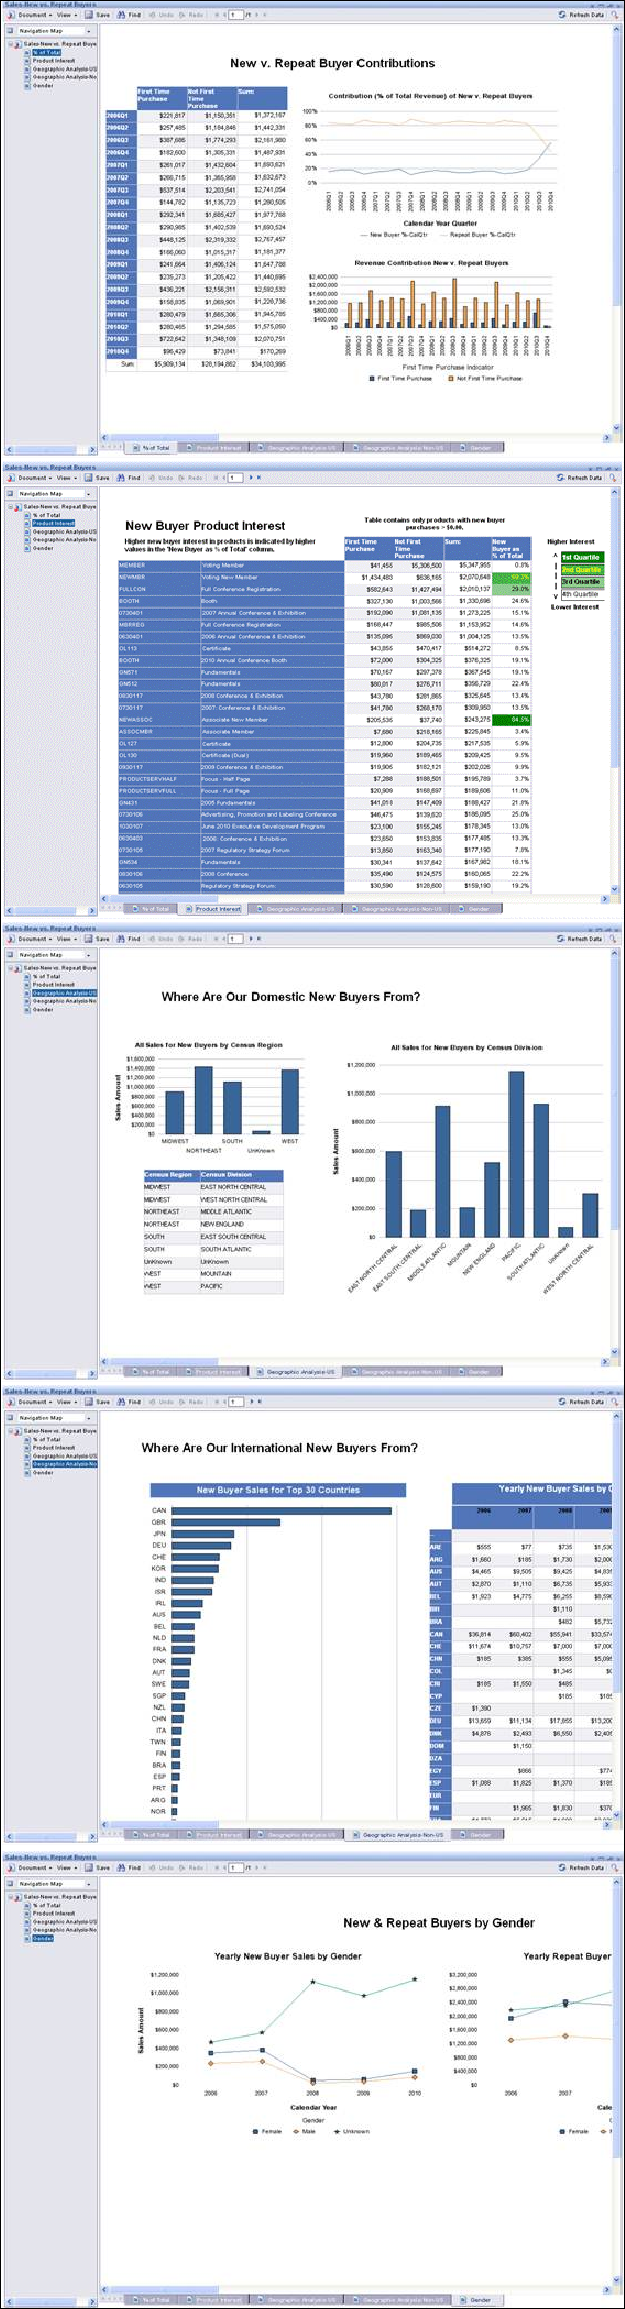
This Revenue Data Mart report displays five reports: % of Total, Product Interest, Geographic Analysis – US, Geographic Analysis – Non-US, and Gender. The % of Total report displays quarterly sales revenue contribution of New vs. Repeat Buyers over the past five years. The Product Interest report displays New Buyer Product Interest showing revenue from new buyers as a % of total revenue for those products that were purchased by new buyers. The Geographic Analysis – US report displays Domestic (U.S. only) New Buyer Geographic Distribution showing new buyer location by Census Region, Census Division, State, including a five year ranking of states based on new buyer revenue. The Geographic Analysis – Non-US report displays International (Non-U.S.) New Buyer Geographic Distribution showing new buyer location by Country, including a five year ranking of countries based on new buyer revenue. The Gender report displays New & Repeat Buyer Revenue by Gender for the past five years.
See Also:
· Overview: Revenue Advantage Reports
· Affinity Analysis – Annual Product Pair Purchases
· Affinity Analysis – Monthly Product Pair Purchases
· Demographic Analysis of Sales