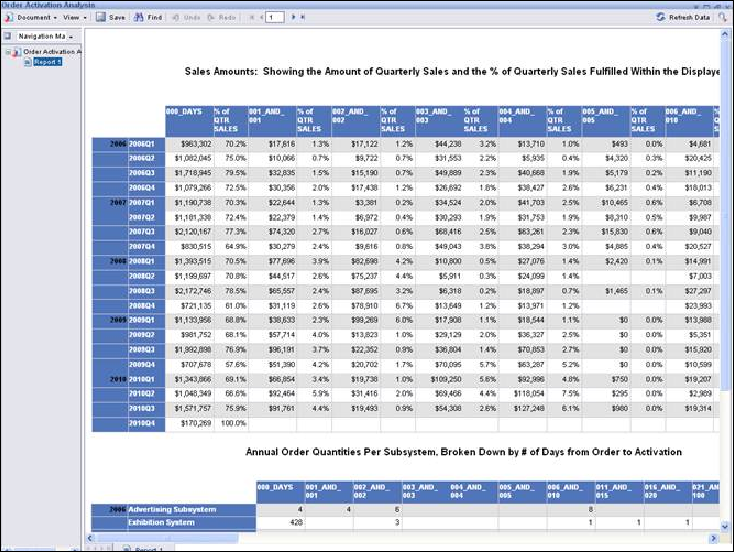
This Revenue Data Mart report displays quarterly sales revenue figures for the past five years showing a breakdown of sales by the number of days between placement of the order and activation of the order. This report also includes a further breakdown showing the number of orders placed by year and by subsystem as they are distributed across the order-to-activation elapsed days brackets.
See Also:
· Overview: Revenue Advantage Reports
· Affinity Analysis – Annual Product Pair Purchases
· Affinity Analysis – Monthly Product Pair Purchases
· Demographic Analysis of Sales
· Sales – New vs. Repeat Buyers