MBR1016 – Analysis
of Chapter Health
This Data Analyzer
query report displays the following three graphs:
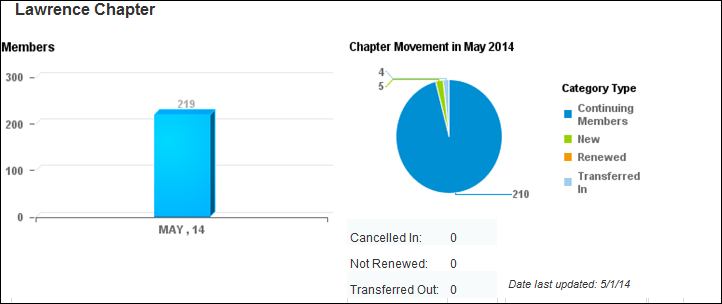
· Pie Chart
This displays new, transferred in, continuing, and renewed chapter members.
New members refers to chapter members that are new to the chapter this
month. Transferred in members refers to chapter members that are new this
month due to a transfer from another chapter. Continuing members refers
to chapter members in their second or later month of chapter membership
for this year. Renewed members refers to chapter members that renewed
their chapter membership this month.
· Table
This shows chapter members that have transferred out, cancelled, or have
not renewed. Transferred out indicates how many chapter members have transferred
out of the chapter this month. Cancelled indicates how many chapter members
have cancelled their chapter membership this month. Not renewed indicates
how many proforma orders were identified for this chapter.
· Chart
This indicates how many members were active during each period when MBR700 has been run and indicates
which month and year each count is for.
You are able to run this report for all chapters/subgroups. In order
for the latest data to populate these charts, you need to run MBR700.
The end time for the latest MBR700 "Completed Status" also displays
on the report, so group managers know how up-to-date the information is.
This report is useful, because you can run it to let you know the following
information:
· You want
to understand the latest movement in or out of a chapter.
· You want
to understand if a chapter is growing, shrinking, or remaining constant.
· You to
understand if a chapter is in better shape than last year at this time.
 As
a best practice, you should schedule MBR700 to run monthly in order for
your chapter manager to view the most up-to-date and meaningful information
on the web. It is expected that a monthly view is standard with the
13th month, so you can compare
this time to last year. If your organization runs MBR700 on a different
cadence, then you will need to look at the dashboard trend graph to determine
if it is showing meaningful data. If not, you may wish to swap the base
graph out for a custom graphic that is more meaningful to your business.
The cadence of the MBR700 is expected to be monthly.
As
a best practice, you should schedule MBR700 to run monthly in order for
your chapter manager to view the most up-to-date and meaningful information
on the web. It is expected that a monthly view is standard with the
13th month, so you can compare
this time to last year. If your organization runs MBR700 on a different
cadence, then you will need to look at the dashboard trend graph to determine
if it is showing meaningful data. If not, you may wish to swap the base
graph out for a custom graphic that is more meaningful to your business.
The cadence of the MBR700 is expected to be monthly.
Group managers are able to view this report on the web and it displays
the same type of data that staff users monitor in Personify360's Subgroup
Central screen. Please note that on the web this report is NOT interactive;
a staff user must run MBR700 in order for a group manager to view the
most up-to-date information. In addition, group managers can only view
data for the chapter that is in focus even if they have access to more
than one chapter. In order for group managers to view this report on the
web, the Report control needs to be configured to display MBR1016. See
Configuring
the Report Control for Analysis of Chapter Health - MBR1016 for more
information.
Parameters
Parameter Name |
Description |
Subgroup Master Customer ID |
The group master customer ID for which
the report is being run. |
Subgroup Sub Customer ID |
The group sub customer ID for which the
report is being run. |
Sample Report