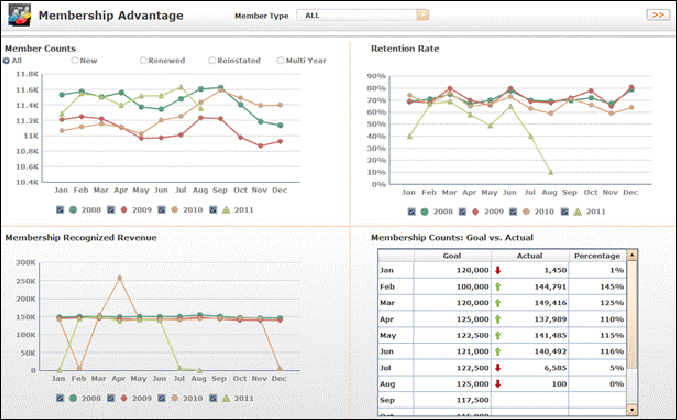
The Membership Advantage Dashboard is divided into four quadrants on two pages, each displaying a different analytic. Depending on the member type selected from the Member Type drop-down list at the top of the dashboard, the appropriate data will be displayed in each of the following analytics: Member Counts, Retention Rate, Membership Recognized Revenue, Membership Counts: Goals vs. Actual, Members Starting this Month, Lapsed Members, and Membership Counts by All Member Types.
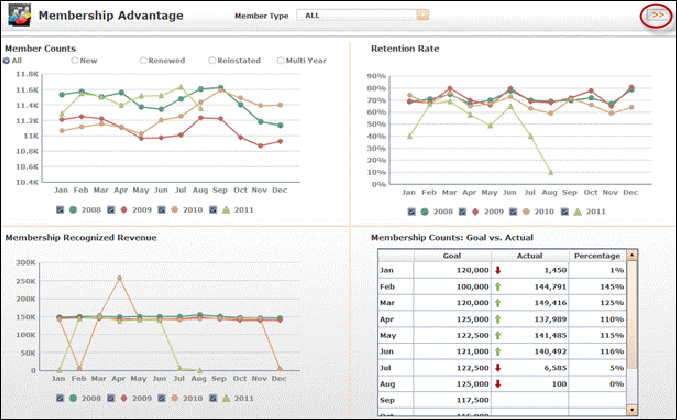
To access the second page of analytics, click the arrow button in the top, right corner, as shown below.
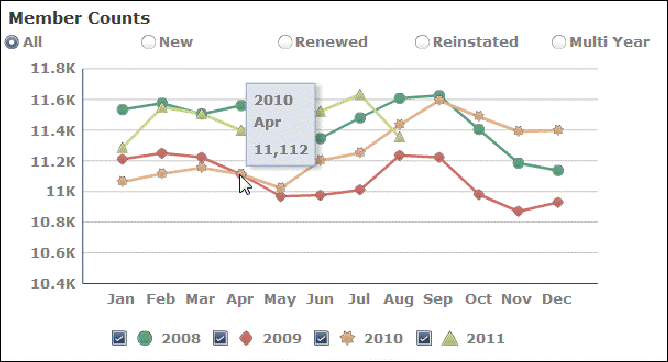
By default, the Member Counts quadrant displays the number of members for all member instatement types over the past four years for the selected member type. Select the appropriate radio button at the top of the quadrant to change the view to member counts by all members, new members, renewed members, reinstated members, or multiyear members. Select or deselect the appropriate year checkbox(es) below the graph to view a specific year member count.
 The radio button selected as the top of the Member Counts quadrant also changes the view of the Membership Recognized Revenue quadrant below.
Hover over a point on the line graph to display exact member count totals for that month and year, as shown below.
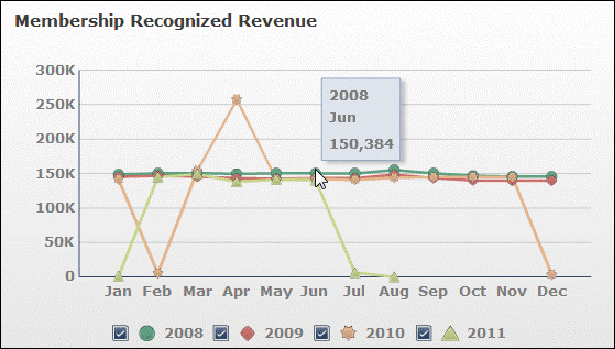
By default, the Membership Recognized Revenue quadrant displays the total dollar amount of recognized revenue for the selected member type and member instatement type (selected in the above quadrant) by month over the past four years. Select the appropriate radio button at the top of the Member Counts quadrant to change the view to membership recognized revenue by all members, new members, renewed members, reinstated members, or multiyear members. Select or deselect the appropriate year checkbox(es) below the graph to view a specific year of the membership recognized revenue.
The radio button selected as the top of the Member Counts quadrant also changes the view of the Membership Recognized Revenue quadrant below.
Hover over a point on the line graph to display exact recognized revenue dollar amounts for that month and year, as shown below.
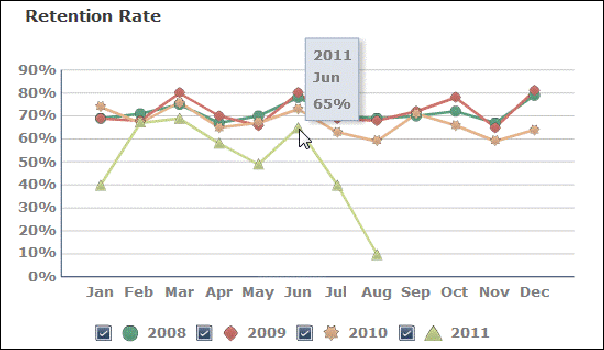
By default, the Retention Rate quadrant displays the retention rate percentage by month over the past four years. Select or deselect the appropriate checkboxes below the graph to change the retention rate display by year.
Hover over a point on the line graph to display exact retention rate percentage for that month and year, as shown below.
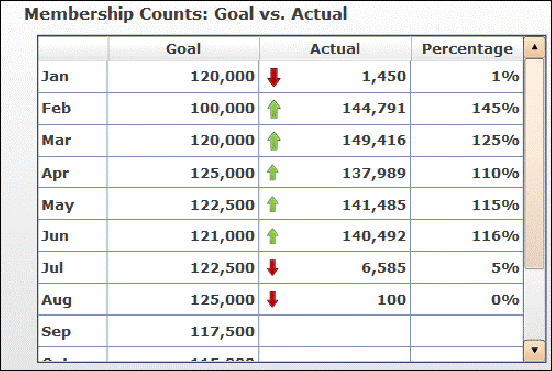
The Membership Counts quadrant displays a table listing the goal and actual membership counts and percentage by month over the past year. A red arrow will display in the Actual column if the actual membership count is less than the goal amount. A green arrow will display in the Actual column if the actual membership count is greater than or equal to the goal amount. The percentage is calculated by dividing the actual amount by the goal amount, multiplying the total by 100, and rounding to the nearest tenth. For example, for the month of March shown below, the percentage is calculated as:
(149,416 / 120,000) x 100 = 124.51333% or 125%.
By default, the Members Starting this Month quadrant displays the number of members starting this month for all member instatement types over the past four years for the selected member type. Select the appropriate radio button at the top of the quadrant to change the view to member starting this month by all members, new members, renewed members, and reinstated members. Select or deselect the appropriate checkboxes below the graph to change the members starting this year by year.
Hover over a point on the line graph to display exact total of members starting for that month and year, as shown below.

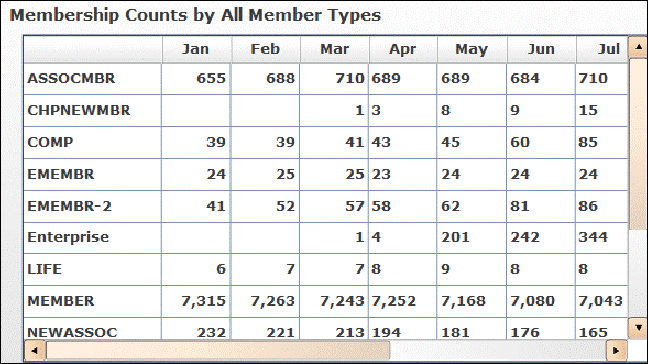
The Membership Counts by All Member Types quadrant displays a table listing the number of members for all member types by month for the current year.
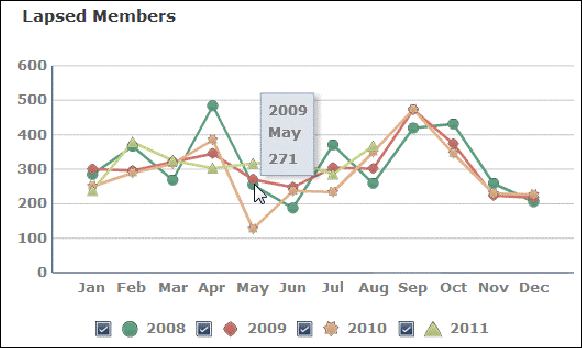
By default, the Lapsed Members quadrant displays the number of lapsed members by month over the past four years. Select or deselect the appropriate checkboxes below the graph to change the lapsed members display by year.
Hover over a point on the line graph to display exact number of lapsed members for that month and year, as shown below.
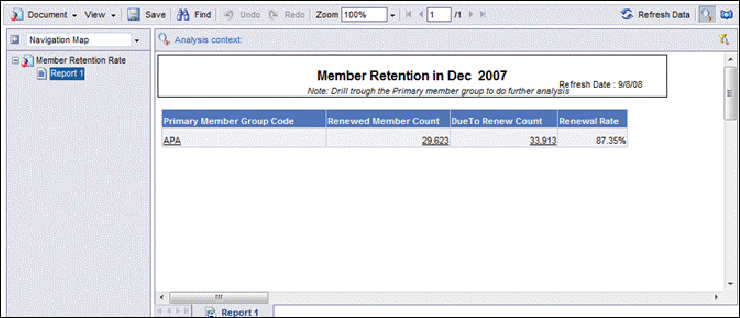
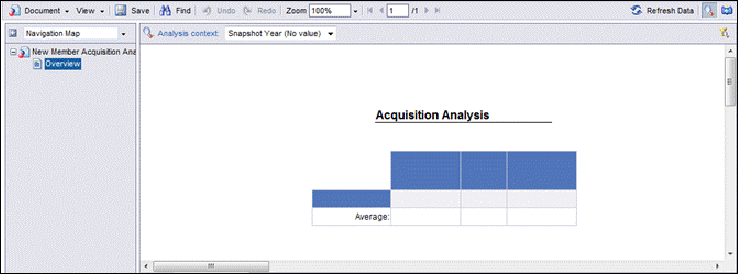
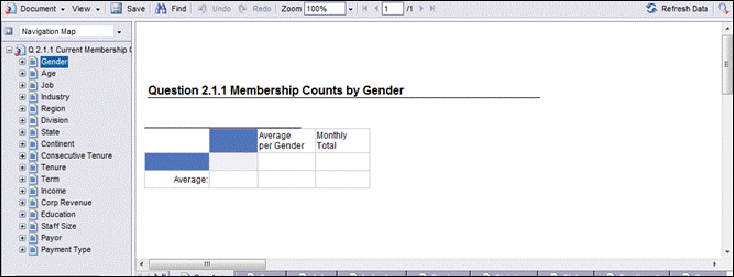
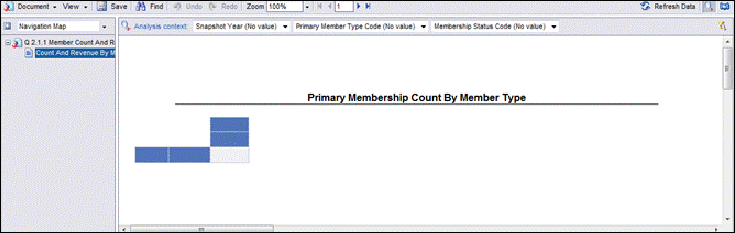
The Favorite Reports quadrant displays reports that can be launched directly from the dashboard. Below is a list of the reports and a sample screenshot:
· Member Retention Rate
· New Member Acquisition Analysis
· Current Membership Counts
· Member Count And Revenue By Member Type
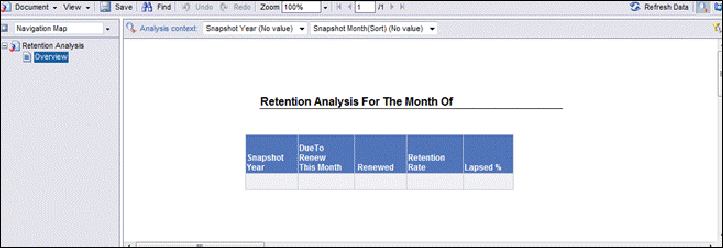
· Retention Analysis
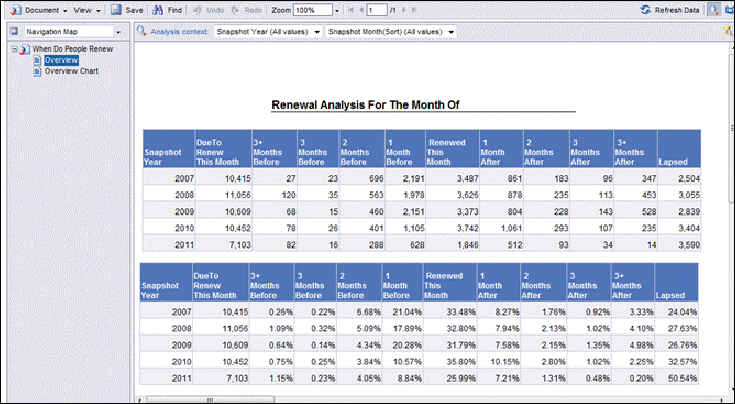
· When Do People Renew
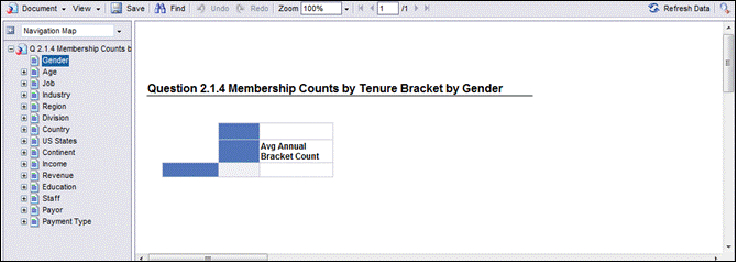
· Membership Counts by Tenure
· Lapsed Members Analysis
See Also:
· Overview: Membership Advantage Data Mart
· Answering User Questions about Membership Analytics
· Membership Data Warehouse Reports
· Membership Advantage Procedures and Considerations
· Membership Advantage Universe