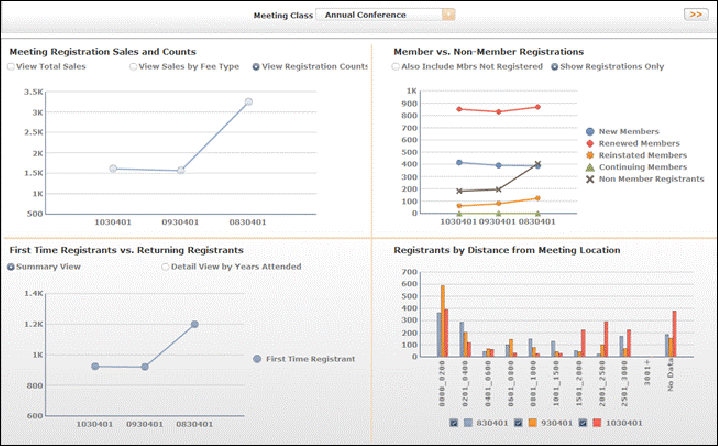
The Meetings Advantage Dashboard is divided into four quadrants, each displaying a different analytic. Depending on the meeting selected from the Meeting Class drop-down list at the top of the dashboard, the appropriate data will be displayed in each of the following analytics: Meeting Registration Sales and Counts, Members vs. Non-Member Registrations, First Time Registrants vs. Returning Registrants, and Registrants by Distance from Meeting Location.
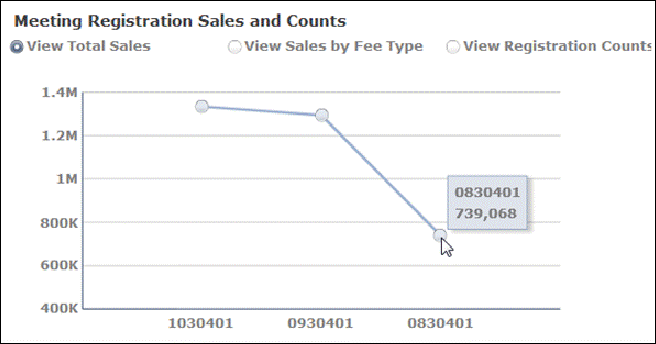
By default, the Meeting Registration Sales and Counts line graph displays the View Total Sales for the selected meeting class. Hover over a dot in the line graph to view exact totals.
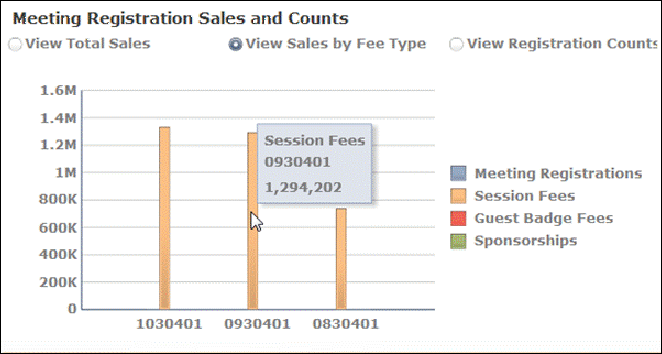
Select View Sales by Fe Type to change the display of the Meeting Registration Sales and Counts analytic. The analytic changes to a bar graph, displaying Meeting Registrations, Session Fees, Guest Badge Fees, and Sponsorships for the selected meeting class. Hover over a bar in the graph to view exact totals.
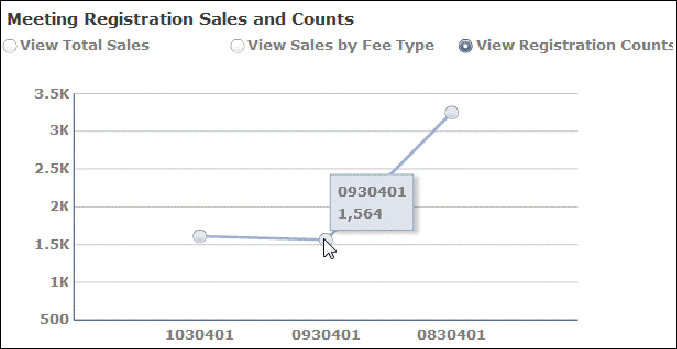
Select View Registration Counts to change the display of the Meeting Registration Sales and Counts analytic. The analytic changes to a line graph, displaying the total registration count for each meeting.
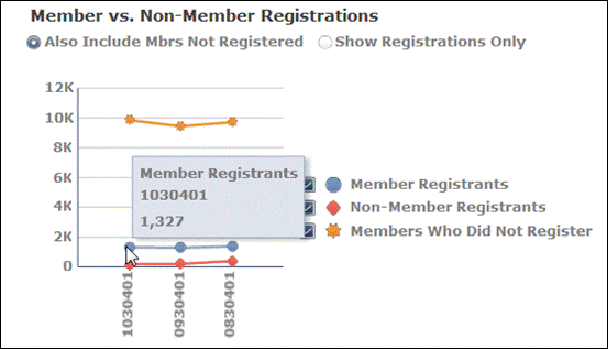
By default, the Member vs. Non-Member Registrations analytic displays Member Registrants, Non-Member Registrants, and Members Who Did Not Register. Uncheck the appropriate checkboxes to change the display. Hover over a dot in the line graph to view exact totals.
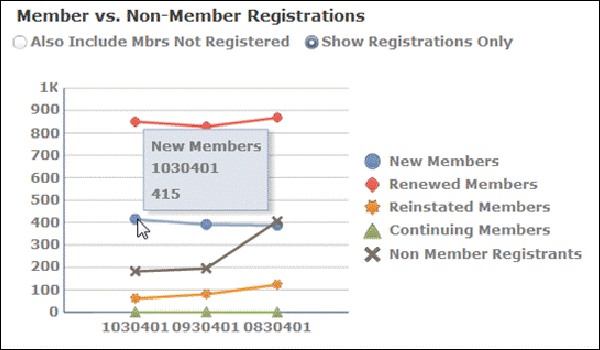
Select Show Registrations Only to displays New Members, Renewed Members, Reinstated Members, Continuing Members, and Non Member Registrants.
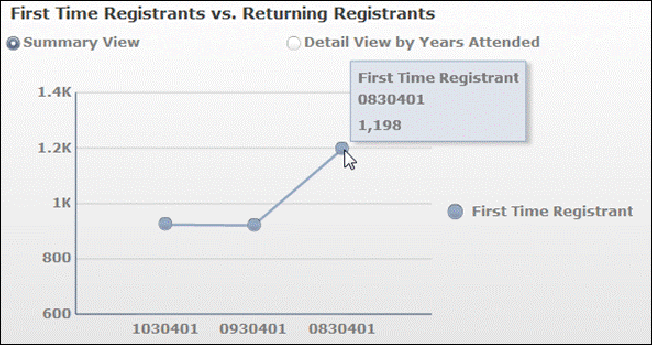
By default, the First Time Registrants vs. Returning Registrants displays a Summary View of first time and returning registrants for the selected meeting. Hover over a dot in the line graph to view exact totals.
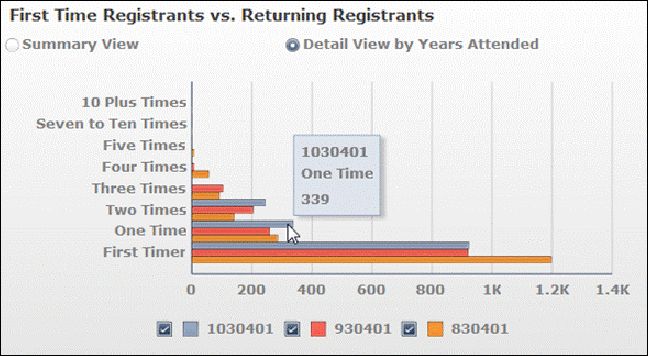
Select Detail View by Years Attended to display 10 Plus Times, Seven to Ten Times, Five Times, Four Times, Three Times, Two Times, One Time, and First Timer for the selected meeting.
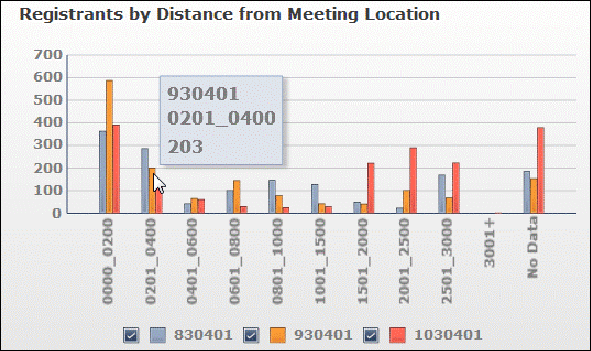
By default, the Registrants by Distance from Meeting Location analytic displays all distances for the selected meeting. Uncheck the appropriate checkboxes to add or remove a meeting to the graph. Hover of a bar in the graph to view exact totals.
See Also:
· Overview: Meetings Advantage Data Mart
· Answering User Questions about Meetings Analytics
· Configuring Meeting Advantage Favorite Reports