This Meetings Advantage report contains two reports: Details by Year and Meeting Counts and Amounts.
For each meeting conducted by the organization, the Details by Year report provides information about the meeting location, registrant counts, revenue generated by the various products associated with the meeting, and registrant counts and revenue by rate structure and rate code.
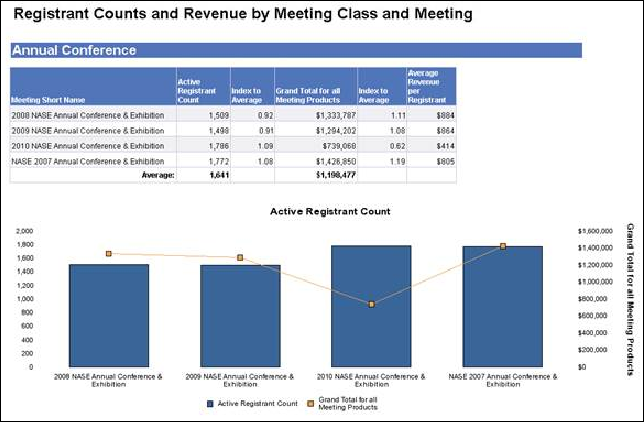
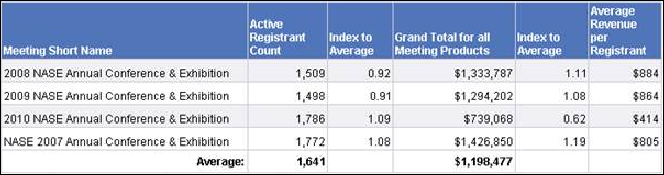
The Meeting Counts and Amounts report breaks down registrant counts and amounts by meeting class and specific meeting within the meeting class.
In the image below, you can see that each row provides information about a specific Annual Conference product. The information includes the number of registrants and the revenue generated through purchases of all products related to the specific conference (including the conference registration fee, sessions, events, badges, and other products associated with the conference). The last column is a calculated value that describes the conference in terms of average revenue per registrant. This is the Grand Total divided by the Active Registrant Count. In addition to these values, there are two “index” columns that compare the specific conference’s performance (in terms of registrants and revenue) to the average performance for all conferences.
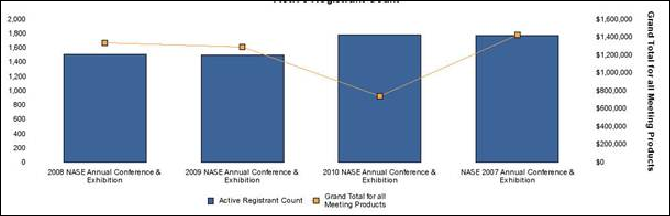
The combination chart below relates revenue for each meeting product under analysis to the number of registrants. The columns (bars) show registrant counts (scaled along the left edge), and the line shows revenue (scaled along the right edge).
See Also:
· Overview: Meetings Advantage Reports
· Registrant Demographic Report
· Registrant Geographic Report
· When Registrants Register Report