The SQL Trace window displays as shown below.
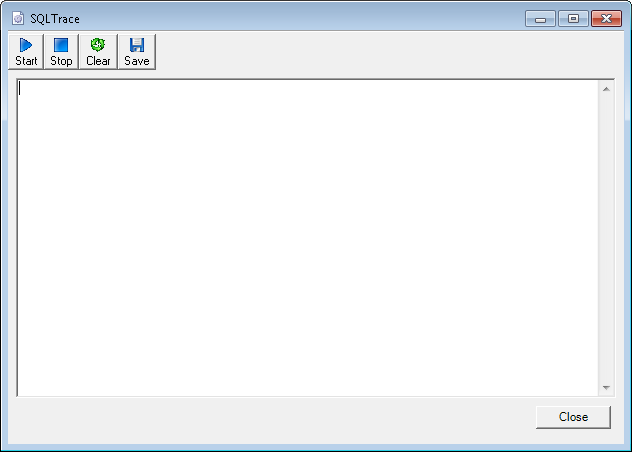
The SQL Trace function is used to view the SQL statements of the user’s actions. A start and end date and time display for every action performed. This information is helpful to determine the cause of performance issues within the application.
To use the SQL Trace:
1. From the Personify360 main toolbar, select Tools > Debug Tools Open SQL Trace.
The SQL Trace window displays as shown below.
2. Click Start to start the SQL trace.
The SQL statement for the actions performed in Personify360 display.