 This feature is not available by connecting to the SQL Server.
The Debug Tracer allows you to see what the client PC is doing behind the scenes. This is helpful when trying to identify system errors, which can occur with newly implemented or modified screens. The different traces performed to locate a problem are:
· Trace SQL statements - Displays the SQL statement so you can see not only what is being looked for, but how it is looking for it. Using this you can diagnose statement syntax and performance.
· Trace Command Execution - Displays every command.
· Trace Control Events - Records the user navigation.
· Trace Configuration Events - Displays the configuration events.
This feature is not available by connecting to the SQL Server.
To use the Debug Tracer:
1. From the Personify360 main toolbar, select Tools > Debug Tools Open Debug Tracer.
The Debug Tracer window displays as shown below.
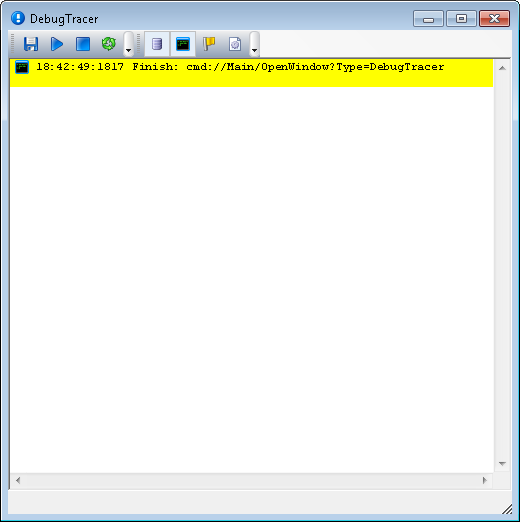
2. Using the toolbar in the Debug Tracer screen, you can perform the following functions by clicking the associated button:
· Save the trace
· Start the trace (Only needed if the trace is stopped. The trace starts automatically when the Debug Tracer is opened.)
· Stop the trace
· Clear the trace
· Trace SQL statements (default is “on”)
· Trace Command Execution (default is “on”)
· Trace Control Events (default is “off”)
· Trace Configuration Events (default is “off”)
The debug tracer is also useful for the replication of commands. For example, if a screen uses a command that you wish to replicate, you can use the tracer to see how the system uses the command and copy it.