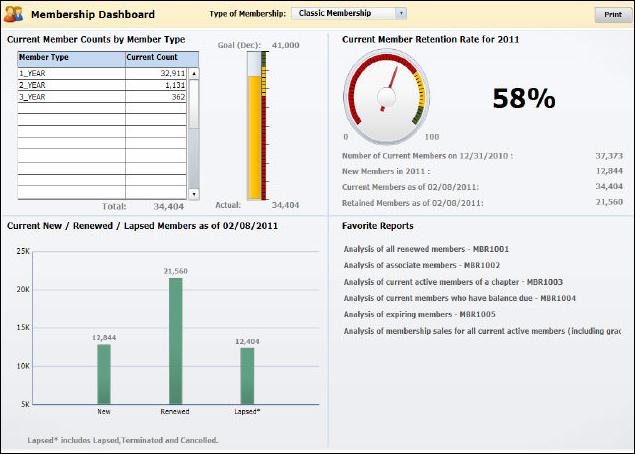
The OrderDashboard universe provides data to the Membership dashboard to analyze the Membership module.
The results appear in a variety of charts and graphs and outline various categories such as:
· Current Member Counts by Member Type
· Current Member Retention Rate for [Current Calendar Year]
· Current New/Renewed/Lapsed Members as of [Current Date]
· Dashboard Data Source Reports
The following image is an example of the Membership dashboard:

The Membership dashboard displays various analytics that provide a snapshot of the Membership module. The level 1 member group selected from the Type of Membership drop-down will determine the data that is displayed in each section. By default, the primary level 1 member group is selected in the drop-down.

Click Print to configure and print a snapshot of the Membership dashboard.
The Current Member Counts by Member Type section displays a chart listing the current counts of members, based on the selected level 1 member group. In Personify360, member type for the primary membership is the level 2 of the primary level 1 of the primary member group. The total number of memberships is displayed below the chart.
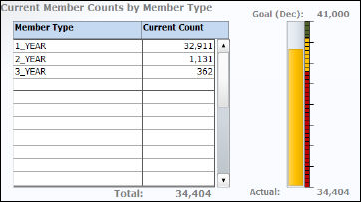
If the primary level 1 member group is selected from the Type of Membership drop-down, a progress bar will be displayed to the right of the chart. The progress bar will NOT display is the type of membership selected in NOT a primary level 1. The number at the top of the progress bar indicates the goal as of the current date. The actual number of membership is displayed at the bottom of the progress bar. The color of the progress bar will change depending on the position within the progress bar. When setting up goals, as discussed in later sections, a low, medium, and high range of each goal is specified. If the association is doing poorly at reaching the goal and still has a long way to go, the progress bar appears red. If in the medium range, the progress bar appears yellow. If close to achieving the goal, the progress bar appears green.
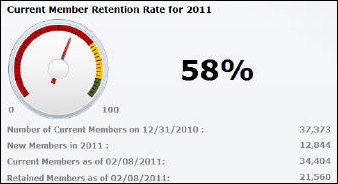
The Current Member Retention Rate for [Current Calendar Year] section displays the number of members as of December 31st of the previous calendar year, the number of new members in the current calendar year, the number of current members as of the current date, and the number of retained members as of the current date. The retention rate displayed in the dial is calculated by the number of current members as of the current date, minus the number of new members in the current calendar year, and then divided by the number of members on December 31st of the previous year. For example, if an association currently has 34,404 members, 12,844 new members in the current year, 37,373 current members as of December 31st of the previous year, then the retention rate is 58%:
(((34,404-12,844)/37,373)*100) = 57.688 or 58%.
The Current New/Renewed/Lapsed Members as of [Current Date] section displays a bar graph of new, renewed, and lapsed members.
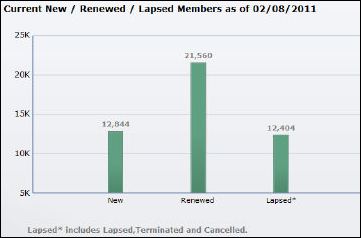
Hover over a bar in the graph to display the exact member count.
The count of new members is the number of current members who new as of the previous year, as opposed to renewed. The count of new member does not include members who joined in the current year.
The membership end date is used when evaluating whether members who are transferring or terminating their membership are still considered current members. Grace is given to members who may renew and does not apply to members who are transferring or terminating.
The count of renewed members is the number of current members (active or in grace), whose membership has been renewed as of the previous year, as opposed to being a new membership. The count of renewed members does not include members who renewed in the current year OR members who renewed in the current year for a membership that begins next year. The sum of new and renewed members should equal the total count of current members (displays in the section above).
The count of lapsed members is the number of members who were current members (active or in grace) during the current calendar year or on the last day of the previous calendar year, but are no longer current because they did not renew their membership. The count of lapsed members also includes terminated, transferred, and cancelled members.
The count of terminated members is the number of current members (active or in grace) during the current calendar year or on the last day of the previous year, but who are no longer members because their membership was terminated in the current calendar year.
The count of transferred members is the number of current members (active or in grace) during the current calendar year or on the last day of the previous calendar year, but are no longer members because they transferred to a different membership with a different level 1 member group.
Customers who were members on the last day of the previous calendar year must be selected so that if a member’s membership end date is the last day of the previous calendar year, they will be counted in January.
Click on the link to open the report in a new window.
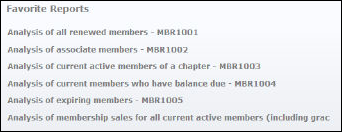
The reports in this section can be configured based on your favorite reports. Please see Configuring your Favorite Data Analyzer Webi Reports for more information.
The Favorite Reports section displays the following list of reports:
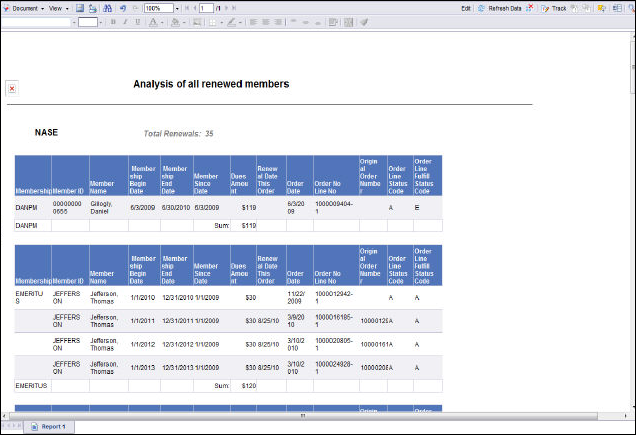
· Analysis of all renewed members - MBR1001
This report displays a list of all renewed members of the organization.
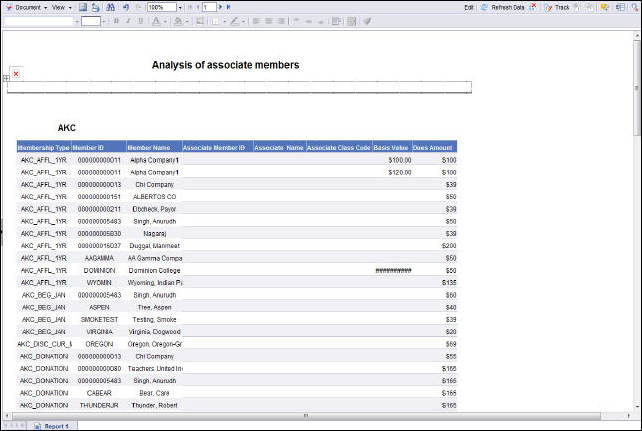
· Analysis of associate members - MBR1002
This report displays a list of all associate members of the organization.
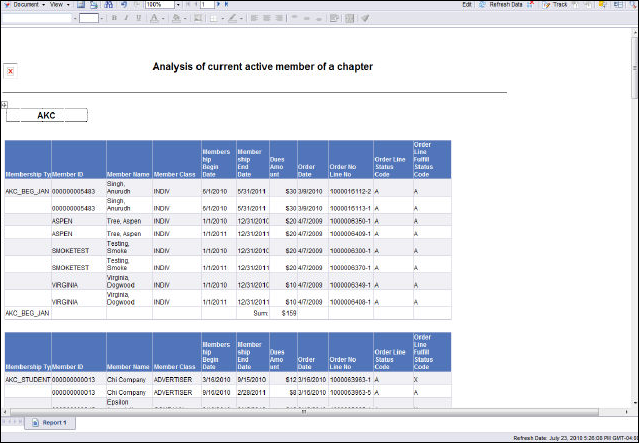
· Analysis of current active members of a chapter - MBR 1003
This report displays a list of all current active members by chapter.
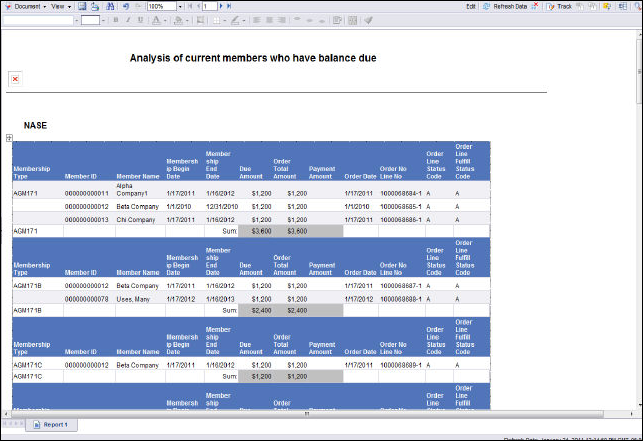
· Analysis of current members who have balance due - MBR1004T
This report displays a list of current members who have a balance due for the organization.
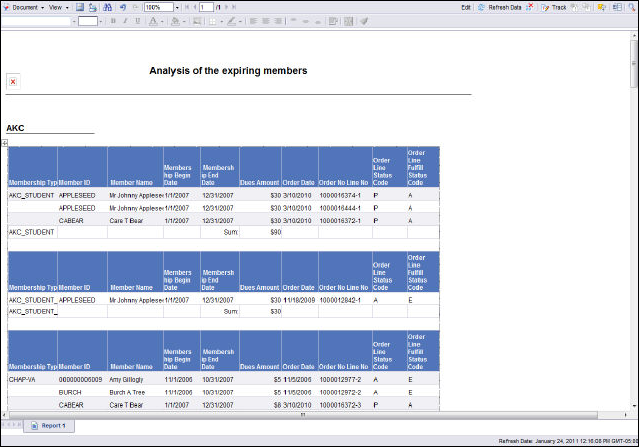
· Analysis of expiring members - MBR1005
This report displays a list of members who are expiring as of the selected date.
· Analysis of membership sales for all current active members (including grace) - MBR1006
This report displays a list of membership sales for all current active members of the organization.
_-_MBR1006.png)
The Membership Dashboard gets its data from the Webi reports (also called documents) listed below, which get their data from the Memberships universe and OrderDashboard universe. The destination cells in the Xcelsius worksheet, into which the data from the Webi documents is mapped, are shown in the Maps to… column.
| Document Name | Universe Name | Maps To . . . |
|---|---|---|
| Current Member Counts by Member Type_xml | OrderDashboard | Maps to member counts by member type. |
| Primary Membership Goal_xml | OrderDashboard | Maps to the goal amount displayed in the top, left quadrant of the dashboard. |
| New_Renewed_Lapsed Members_xml | OrderDashboard | Maps to the current new, renewed, lapsed members quadrant of the dashboard. |
| Retention_Rate_xml | OrderDashboard | Maps to retention rate gauge and data in the top, right quadrant of the dashboard. |
| MBR Favorite Reports_xml | OrderDashboard | Maps to the favorite reports in the bottom, right quadrant of the dashboard. |