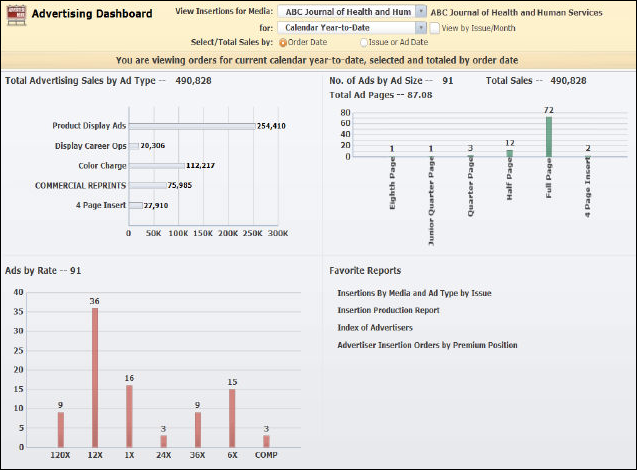
The Advertising dashboard analyzes the Advertising module with data provided by the Advertising universe.
The results appear in a variety of charts and graphs and outline various categories such as:
· Total Advertising Sales by Ad Type
· Dashboard Data Source Reports
The following image is an example of the Advertising dashboard:

The information displayed on the dashboard is based on the options you choose from the drop-downs, checkboxes, and radio buttons in the top toolbar.

The View Insertions for Media drop-down includes every media entered in the Advertising module. You can only view information for one media code at a time. Select the media code from the drop-down to view data for the selected media in each analytic. The full description of the media will be displayed to the right of the drop-down.
You can also select the time period for which to view the data. From the for drop-down, select either ‘Calendar Year-to-Date’, ‘Fiscal Year-to-Date’, or ‘Issue/Month’. If you select Calendar Year-to-Date or Fiscal Year-to-Date, the View by Issue/Month checkbox will be displayed to the right. Select this checkbox if you would like to view insertion orders by issue or month.

If you select Issue/Month, another drop-down will be displayed to the right in which you can select a specific issue or month.

Advertising orders are placed well in advance of the ad-run date. Therefore, from Select/Total Sales by, select whether to view data by Order Date or Issue or Ad Date.

An overview description is displayed at the bottom of the toolbar, summarizing your selections.

The Total Advertising Sales by Ad Type section displays the total sales amount for each ad type code of the selected media.
The number displayed to the right of the analytic title is the total sales amount for the selected media.
If you select ‘Calendar Year-to-Date’ or ‘Fiscal Year-to-Date’, a bar graph displays each ad type and their total sales amount.
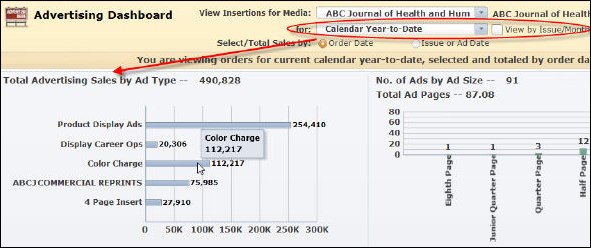
To view the exact sales amount for a specific ad type, hover your mouse over the specific bar.
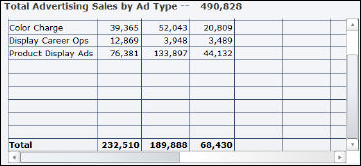
If you select ‘Calendar Year-to-Date’ or ‘Fiscal Year-to-Date’ AND ‘View by Issue/Month’, a chart displays a listing of each ad type and the total sales amount by month.
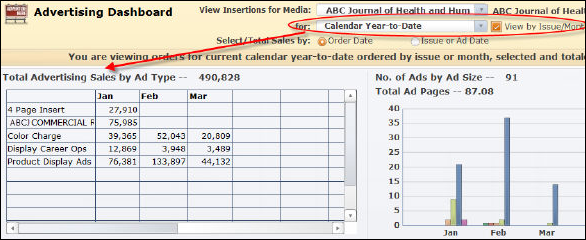
Scroll all the way to the right to view the totals of each ad type:
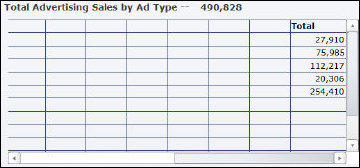
Scroll all the way to the bottom to see the totals of each issue/month:
If you select ‘Issue/Month’, a chart displays a listing of each ad type and the total sales amount for the selected issue by month.
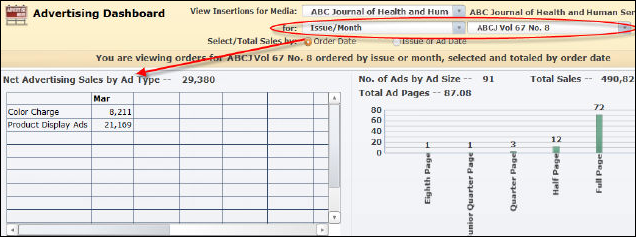
The No. of Ads by Ad Size section displays the total number of ad by ad size code of the selected media.
The number displayed to the right of the analytic title is the total number of ads for the selected media. The Total Sales amount displayed is equal to the total in the Total Advertising Sales by Ad Type analytic. The Total Ad Pages amount displayed is equal to the total in the Ads by Rate analytic.
Total Ad Pages is calculated by adding the percentage associated with each ad size for all ads and then dividing by 100. For example, ABC Journal has two half page ads, which equal one total page (50% + 50% = 100%), and six quarter page ads, which equal one and a half total pages (25% x 6 = 150%). Therefore, ABC Journal has 2.5 (250%/100 = 2.5) Total Ad Pages.
If you select ‘Calendar Year-to-Date or ‘Fiscal Year-to-Date’, a bar graph displays the total number of ads by each ad size.
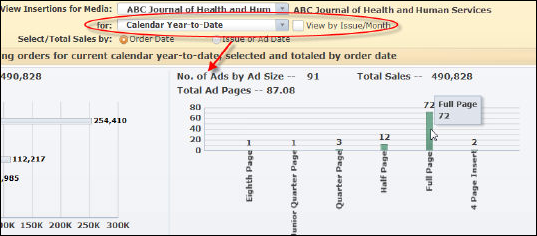
To view the exact number of ads for ad size, hover your mouse over the specific bar.
If you select ‘Calendar Year-to-Date’ or ‘Fiscal Year-to-Date’ AND ‘View by Issue/Month’, a bar graph displays the total number of ads by each ad size for each month.
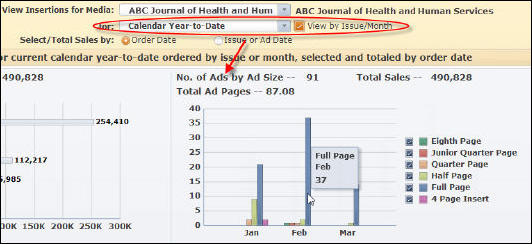
To view the exact number of ads for ad size for a particular month, hover your mouse over the specific bar.
If you select ‘Issue/Month’, a bar graph displays the total number of ads by each ad size for the selected issue/month.
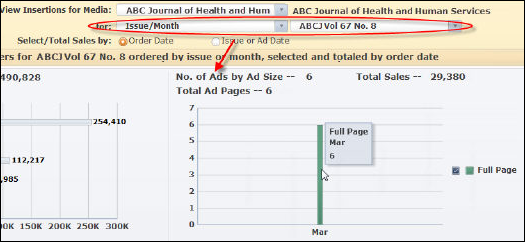
To view the exact number of ads for ad size for a particular month, hover your mouse over the specific bar.
The Ads by Rate section displays the total amount of ads by each rate code.
The number displayed to the right of the analytic title is the total number of ads by ad size for the selected media.
If you select ‘Calendar Year-to-Date’ or ‘Fiscal Year-to-Date’, a bar graph displays the total number of ads by each rate.
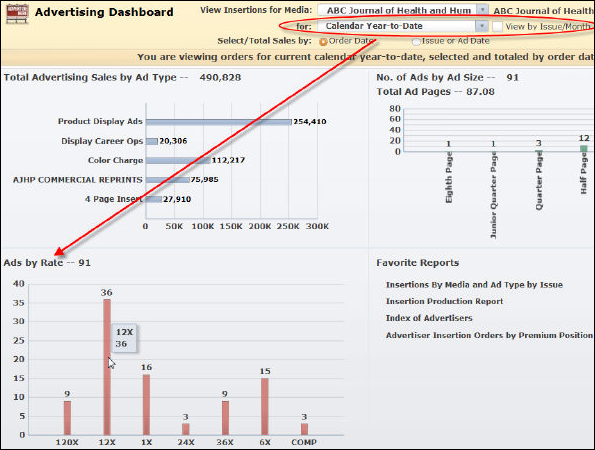
To view the exact number of ads for a particular rate, hover your mouse over the specific bar.
If you select ‘Calendar Year-to-Date’ or ‘Fiscal Year-to-Date’ AND ‘View by Issue/Month’, a bar graph displays the total number of ads by each rate for each month.
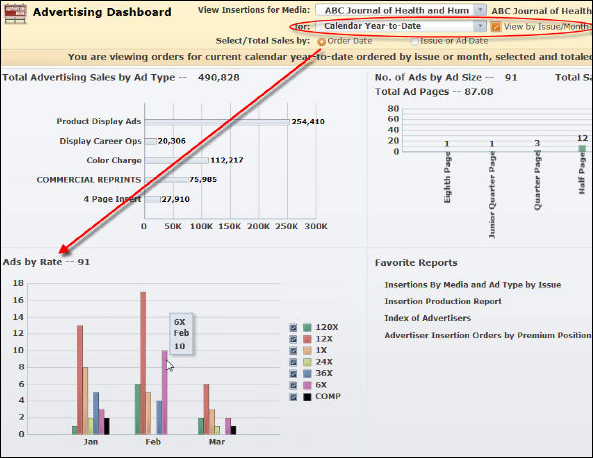
To view the exact number of ads for a particular rate for a specific month, hover your mouse over the specific bar.
If you select ‘Issue/Month’, a bar graph displays the total number of ad by each rate for the selected issue/month.
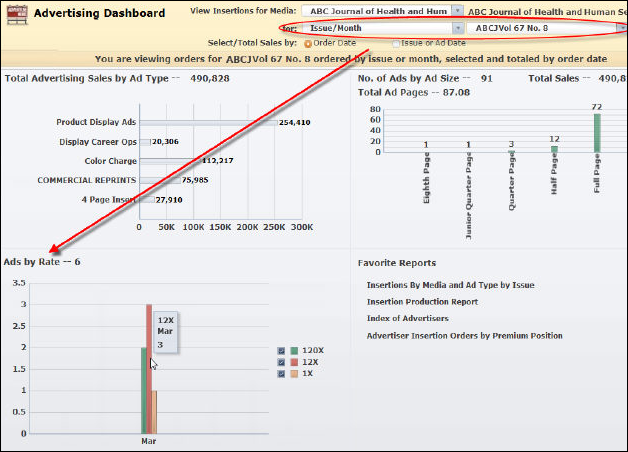
To view the exact number of ads for a particular rate, hover your mouse over the specific bar.
Click on the link to open the report in a new window. The reports in this section can be configured based on your favorite reports. Please see Configuring your Favorite Data Analyzer Webi Reports for more information.
The Favorite Reports section displays the following list of reports:
· Insertions By Media and Ad Type by Issue
This report displays a list of insertion orders by ad type for the selected media and issue date, including type, size, color, position, advertiser ID, bill customer name, agency name, order date, contract ID, order number, insertion order status, quantity, rate structure, rate code, and order amount.
· Insertion Production Report
This report displays a list of insertions order by the selected media and issue date, including product type, ad premium position, section code, advertiser ID, advertiser last first name, ad type/size/color, bleed/special instructions, order number line number, insertion order number, order quantity, and base total amount.
· Index of Advertisers
This report displays a list of advertisers for the selected media and issue date, including product type, advertiser ID, advertiser last first name, and advertiser full address.
· Advertiser Insertion Orders by Premium Position
This report displays a list of advertiser insertion orders by premium position for the selected media and issue date, including advertiser last first name, ad agency name, media description, issue description, product type, ad type, ad size, ad color and webmedia description, order number, line number, insertion order number, order quantity, and base total amount.
The Advertising Dashboard gets its data from the Webi reports (also called documents) listed below, which all get their data from the Advertising Orders universe. The destination cells in the Xcelsius worksheet, into which the data from the Webi documents is mapped, are shown in the Maps to… column.
| Document Name | Universe Name | Maps To . . . |
|---|---|---|
| Ad_Pages_AD_FYD_xml | Advertising Orders | Gets the Total Ad Pages for the selected option in quadrant 2 |
| Ad_Pages_AD_Issue_xml | Advertising Orders | Gets the Total Ad Pages for the selected option in quadrant 2 |
| Ad_Pages_AD_YTD_xml | Advertising Orders | Gets the Total Ad Pages for the selected option in quadrant 2 |
| Ad_Pages_OD_FYD_xml | Advertising Orders | Gets the Total Ad Pages for the selected option in quadrant 2 |
| Ad_Pages_OD_Issue_xml | Advertising Orders | Gets the Total Ad Pages for the selected option in quadrant 2 |
| Ad_Pages_OD_YTD_xml | Advertising Orders | Gets the Total Ad Pages for the selected option in quadrant 2 |
| Ad_Rates_AD_FYD_xml | Advertising Orders | Gets the Ad’s by Rate as per the selected option in quadrant 3 |
| Ad_Rates_AD_Issue_xml | Advertising Orders | Gets the Ad’s by Rate as per the selected option in quadrant 3 |
| Ad_Rates_AD_YTD_xml | Advertising Orders | Gets the Ad’s by Rate as per the selected option in quadrant 3 |
| Ad_Rates_OD_FYD_xml | Advertising Orders | Gets the Ad’s by Rate as per the selected option in quadrant 3 |
| Ad_Rates_OD_Issue_xml | Advertising Orders | Gets the Ad’s by Rate as per the selected option in quadrant 3 |
| Ad_Rates_OD_YTD_xml | Advertising Orders | Gets the Ad’s by Rate as per the selected option in quadrant 3 |
| Ad_Size_AD_FYD_xml | Advertising Orders | Gets the No. of Ad’s by Ad Size as per the selected option in quadrant 2 |
| Ad_Size_AD_Issue_xml | Advertising Orders | Gets the No. of Ad’s by Ad Size as per the selected option in quadrant 2 |
| Ad_Size_AD_YTD_xml | Advertising Orders | Gets the No. of Ad’s by Ad Size as per the selected option in quadrant 2 |
| Ad_Size_OD_FYD_xml | Advertising Orders | Gets the No. of Ad’s by Ad Size as per the selected option in quadrant 2 |
| Ad_Size_OD_Issue_xml | Advertising Orders | Gets the No. of Ad’s by Ad Size as per the selected option in quadrant 2 |
| Ad_Size_OD_YTD_xml | Advertising Orders | Gets the No. of Ad’s by Ad Size as per the selected option in quadrant 2 |
| Ad_Type_AD_FYD_xml | Advertising Orders | Gets the Total Advertising Sales by Ad Type as per the selected option in quadrant 1 |
| Ad_Type_AD_Issue_xml | Advertising Orders | Gets the Total Advertising Sales by Ad Type as per the selected option in quadrant 1 |
| Ad_Type_AD_YTD_xml | Advertising Orders | Gets the Total Advertising Sales by Ad Type as per the selected option in quadrant 1 |
| Ad_Type_OD_FYD_xml | Advertising Orders | Gets the Total Advertising Sales by Ad Type as per the selected option in quadrant 1 |
| Ad_Type_OD_Issue_xml | Advertising Orders | Gets the Total Advertising Sales by Ad Type as per the selected option in quadrant 1 |
| Ad_Type_OD_YTD_xml | Advertising Orders | Gets the Total Advertising Sales by Ad Type as per the selected option in quadrant 1 |
| ADV Favorie Reports_xml | Advertising Orders | Gets the list of favorite reports in quadrant 4 |
| Issue_xml | Advertising Orders | Gets the list of issues for the selected issue based media in the drop down |
| Media_xml | Advertising Orders | Gets the last two years insertion media codes for the drop down |