After installing Dashboards on your client machine, you can begin building custom dashboards for Personify or modify the base dashboards delivered with your Personify release package.
This objective is to provide a jump start in building your own dashboard. As part of the release package we have provided a sample excel model and the same model has been explained in this document.
The excel model provides you with the integration points to extract the data for the dashboard. Also, the step-by-step instructions provided in this document help you to build a sample meeting dashboard.
The instructions assume you are already familiar with building Data Analyzer reports and using the Microsoft Excel application.
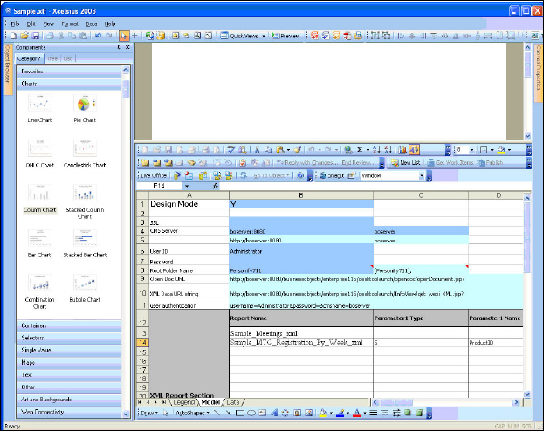
You can import the excel model to Dashboards before you start building your dashboard. This excel model has three tabs. The first tab explains the legends used in the model tab and data tab to make the references easier. The data tab will be used to fill the data when the XML data is brought into the dashboard.
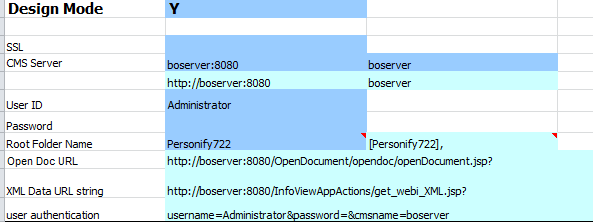
The Model tab contains several predefined variables and formulas. The details of each one of them appear below.
All the dashboard connection information fill based on the value of this mode.
(Cell reference : B1)
· If you plan to launch the dashboard from a website or as a stand-alone page, set this flag to Y.
· If you are plan to launch the dashboard from Personify and/or BusinessObjects, set the value to N before exporting the dashboard to BusinessObjects.
· This value can be set through a flash variable.
If you are plan to launch the dashboard from your website (portal), the data communication with the BusinessObjects server should be secured. To do so, enable the SSL in the BusinessObjects Server. Once you enable the SSL, set this flag to Y.
(Cell reference : B3)
· Use this flag if you plan to the launch the dashboard from a website as a flash document.
· When launching, if the BusinessObjects server is accessed through a secured URL, set this flag to Y.
· This value can be set through a flash variable.
This information accesses the BusinessObjects server to gather the data during the design mode and when launching the dashboard from any website.
(Cell reference : B4)
· Set this cell with server and port information.
For example, boserver:8080.
· This information accesses the BusinessObjects server to gather the data during the design mode and when launching the dashboard from any website.
· This information is not used when launching the dashboard from Personify and/or the BusinessObjects BI Launchpad page.
· This value can be set through a flash variable.
This is the CMS server on which you installed BusinessObjects. It is used when fetching XML data when you launch it from an external website and in the design mode.
(Cell reference : C4)
· This cell should be set with the CMS server name.
For example, boserver.
· This information authenticates when fetching the XML data during the design mode and/or when launching the dashboard from an external website.
· This information is not used when launching the dashboard from Personify and/or the BusinessObjects BI Launchpad page.
· This value can be set through a flash variable.
This is the BusinessObjects user ID and password. It is used to fetch the XML data from the dashboard when you launch it from an external website or in the design mode.
(User ID’s Cell reference : B6; Password’s Cell reference : B7)
· You can set this variable through a flash variable.
· This information authenticates when fetching the XML data during the design mode and/or when launching the dashboard from an external website.
· This information is not used when launching the dashboard from Personify and/or the BusinessObjects BI Launchpad page.
This is the root folder where reports are located in Data Analyzer and is for the drillable reports used in dashboards.
(Cell reference : B8)
· This cell holds the BusinessObjects environment folder information.
· It is also called the client environment folder which is stored in the Personify BusinessObjects parameters in APP014.
· This folder helps to locate the Webi reports.
· This value can be set through a flash variable.
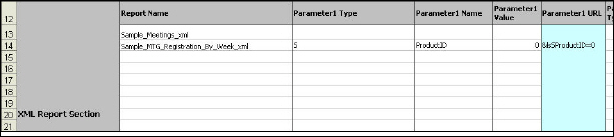
Webi report created to deliver data to the dashboard.
For example, in the Membership dashboard, the best practice is to keep these reports under [Root Folder]/Dashboard/Membership/XML Queries and name the reports suffixed with “_xml.”
You can set the parameters for the reports developed as one of the following types:
· S = Single prompt value
· M = Multiple prompt value.
Values should be separated by a comma.
For example, [USA],[CAN], etc.
· R = Range of values
Values should be separated by double dot (..).
For example, format the date range as [DateTime(2007,1,1,0,0,0) . .
DateTime(2008,12,1,0,0,0)]
· C = Contextual prompt value
Used if there is an ambiguity during SQL generation.
 In the above XML report setup, we provided four parameters. In case your reports have more than four parameters, you may modify the model by inserting more columns to add parameters and modify the formula.
Name of the first parameter in the reports.
The name should match exactly as you created it in the report.
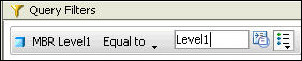
In the above screenshot, the parameter name is “Level1.”
The parameter names are case-sensitive and TMA Resources recommends you to keep the parameter name simple.
The value to the parameter prompt should be passed appropriately based on the parameter type.
This is a formula field that builds the URL based on the parameter type, parameter name, and value.
This cell’s values may be used by the URL button to invoke the report.
For example, if you wish to trigger the report when there is any change in parameter 1 and/or parameter 2 values, you may apply a formula in this cell to concatenate the parameter 1 and/or parameter 2 values.
Possible values are TRUE or FALSE.
· Setting the value to TRUE gets the latest schedule report output instance data.
If an instance doesn’t exist, it runs the report and fetches the data.
· Setting the value to FALSE runs the report and fetch the data.
This is a formula field that constructs the complete http URL based on all the above information. The Dashboards data manager references this cell.
The data gathers in the dashboard in XML format.
In the above report setup, we provided four parameters. In case your reports have more than four parameters, you may modify the model by inserting more columns to add parameters and modify the formula.
This is the location of the report in BusinessObjects.
For example, if the report is located under [Root Folder]/Dashboard/Meeting/Reports , you should enter the path as [Dashboard],[Meeting],[Reports].
This provides roster information for the summary displayed in the dashboard. For example, for the Membership dashboard, the best practice is to keep these reports under [Root Folder]/Dashboard/Membership/Reports.
As a best practice, you may maintain your custom dashboards as shown below:
· [Root Folder]/Custom Dashboard/Sub System/Reports
· Sub System may be Membership, Subscription etc.
This is the same as explained in the above section “XML Report Data Section”
This is same as explained in the above section “XML Report Data Section"
This is same as explained in the above section “XML Report Data Section”
This is same as explained in the above section “XML Report Data Section”
This is same as explained in the above section “XML Report Data Section”
Possible values are TRUE or FALSE.
· Setting the value TRUE gets the latest schedule report output instance data.
If an instance doesn’t exist, it runs the report and fetches the data.
· Setting the value FALSE runs the report and fetches the data.
If parameters exist in these reports when taking the report output instance, it checks if the parameter value matches or else it runs the report with the current parameter values.
This is same as explained in the above section “XML Report Data Section”; however, this URL maps to the URL button component.
This section assumes you are familiar with building Data Analyzer reports and Microsoft Excel. It details the main steps for building the two reports for the dashboard data and another report for a roster report. To do so, complete the following steps:
1. Create the first dashboard report that lists all current and future meetings.
2. Create the second dashboard report that lists meeting registrant counts by week for a specific meeting.
3. Create the roster report as a Sample_MTG_Registration_Roster.
To create and save a Data Analyzer report listing all future meetings:
1. Build a Data Analyzer report as displayed below.
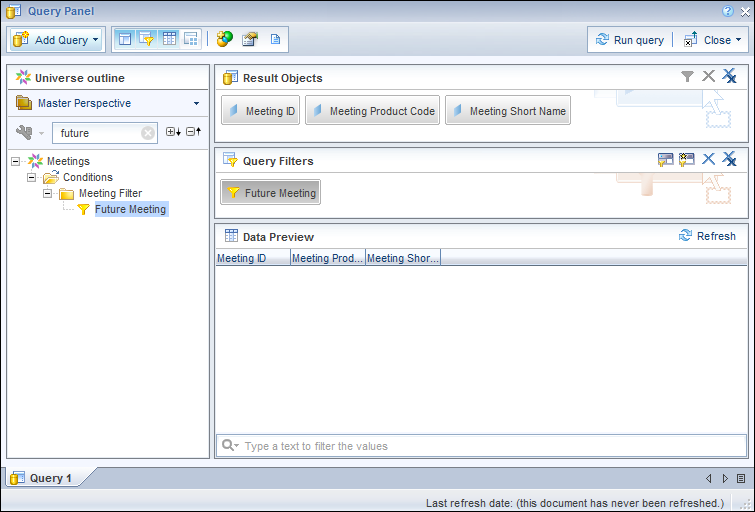
2. Run the report and make sure it produces the output.
3. Click the Document tab.
4. Click Properties.
5. Check the Refresh on open checkbox, as highlighted below.
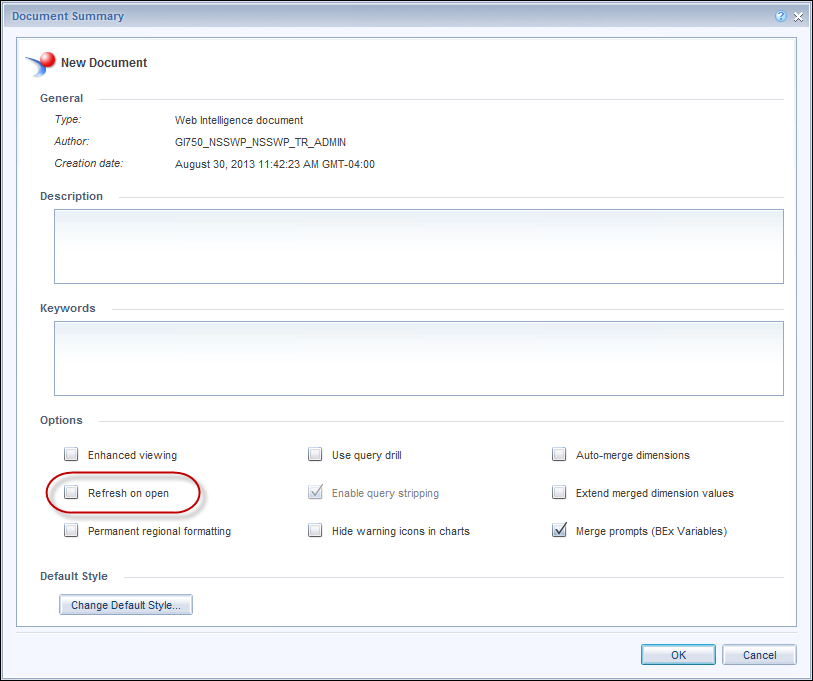
6. Click OK.
7. Save the reports.
For example, “Sample_Meetings_xml.”
You may schedule this report with the acceptable frequency to improve the performance.
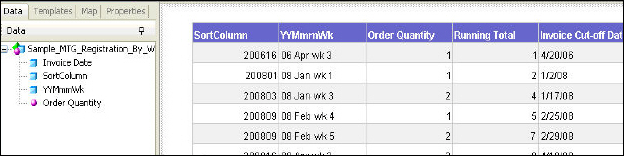
To create and save a Data Analyzer report listing the registrant count by week:
1. Build a report as displayed below.
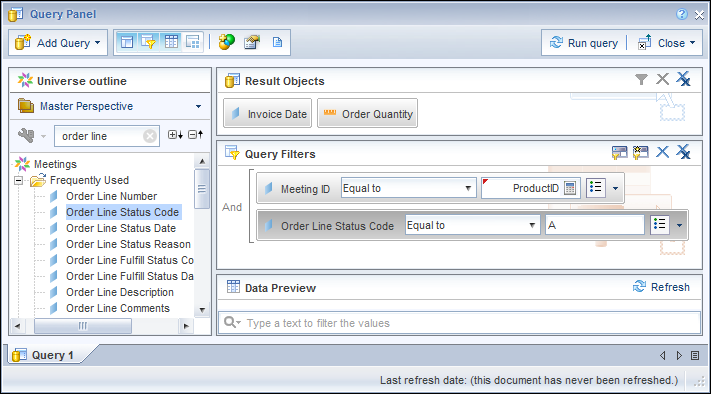
2. Save the report.
For example, “Sample_Meetings_xml.”
You may schedule this report with the acceptable frequency to improve the performance.
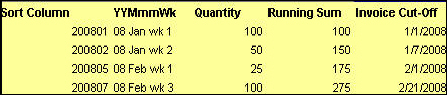
3. Create two local dimension variables to format the date for sorting (SortColumn) and display by week (YYMmmWk).
4. Place these dimension variables as shown below and place the last column which holds the max invoice number for that week.
This max invoice value is later used to run a roster report.
The “Running Total” column has the following function: RunningSum([Order Quantity]).
Invoice cut-off Date has the following function: Max([Invoice Date]).
5. Set the document properties as explained in the previous report.
6. Save the report.
For example, “Sample_MTG_Registration_By_Week_xml.”
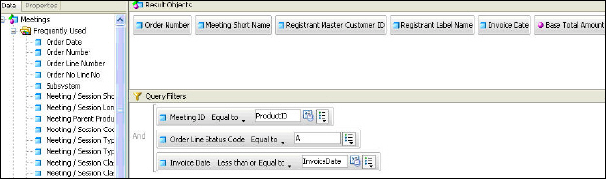
To work with a report of the Registrant Roster:
1. Build a report as shown above with two filters with prompt.
The first prompt would take the Meeting ID and the other would take the invoice date.
All registrants registered for this meeting and all orders less than or equal to the given invoice date will be listed in the roster.
2. Format the roster appropriately.
Now that we have reports ready to deliver the data for the dashboard, we can start designing and building the dashboard.
The steps to design and build the dashboard include the following:
1. Setting Up the Canvas Properties
2. Importing the Template Excel Model
3. Setting Up the Dashboard Header
4. Setting Up the Combo Box to List Meetings
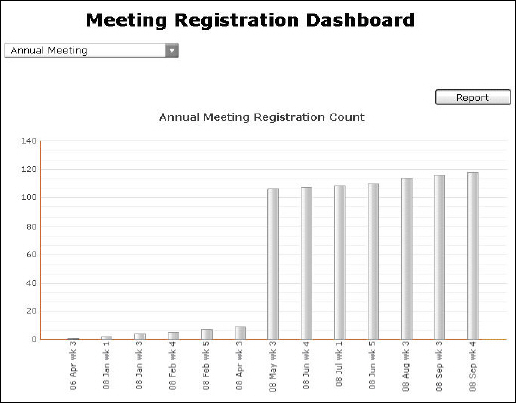
5. Setting Up the Bar Chart to Display the Count
6. Adding a Report Button Component
To set up the canvas properties:
1. From the menu bar, select File > Document Properties.
2. Set the canvas size to 713 x 609.
This size fits the Personify landing area.
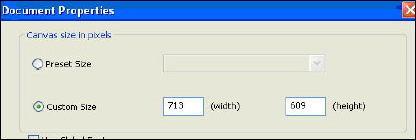
You may change the canvas size to a different value if you are planning to launch the dashboard from a different site.
3. Set the Canvas properties as follows:
a. Type = Solid Color
b. Background = White
To import the template Excel model:
1. From the menu bar, select Data > Import.
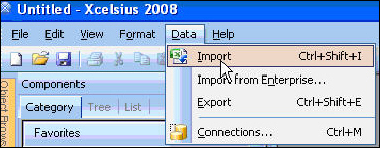
2. Select model.xls and import the excel model.
Now you should see three sheets (Legend, Model and Data) in the Excel panel.
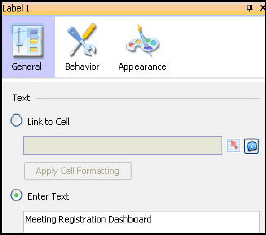
To set up the dashboard header:
1. Drag and drop the label component from the components panel.
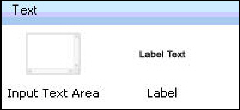
2. Go to the General tab of label’s property (located in the right pane) and fill the “Enter Text” property as “Meeting Registration Dashboard.”
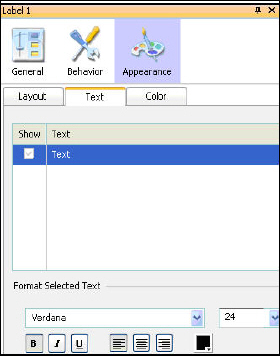
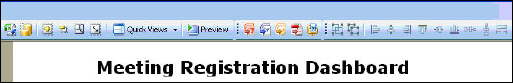
3. Go to the appearance tab and set the text to 24 pt., bold, and center-justified.
You may align and adjust the label so it appears as illustrated below.
To set up the combo box to list meetings:
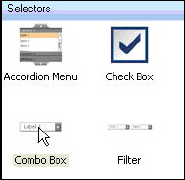
1. Go to the selector tab in the component panel and drag and drop the combo box into the design area.
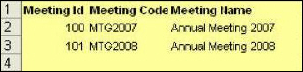
Below is an example of a few sample data entered in the data sheet to show how the report deliverers the data.
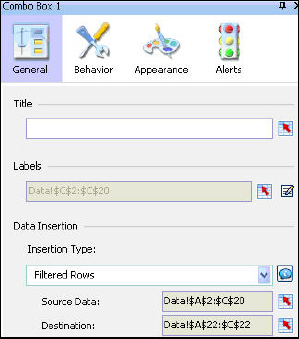
2. Select the General tab of combo box’s property (located in the right pane).
3. Click the icon located at the right side of the “Labels” and mark C2 to C20 from the data sheet.
We did not consider the first row due to the fact the header of the report would take up the first row.
4. Set the Insertion type to “Filtered Rows.”
5. Set the Source Data to A2 to C20 from the datasheet.
6. Set the Destination as A22 to C22 from the Data sheet.
If a meeting is selected in the combo box, it filters that particular row and places it into A22 to C22.
After doing the above settings, the property window would appear as shown below.
You may now preview the dashboard to see the sample data which you just entered.
7. Highlight A22 to C22 with  to represent the filtered data. Refer the legend sheet for color coding standards.
The Meeting ID of the filtered row feeds as the parameter to the second report.
Details on how this is done appear in the later section, “Setting up the Data Manager Connection for the Live Data.”
8. Click the behavior tab and check the “In Values” checkbox,
To set up the bar chart:
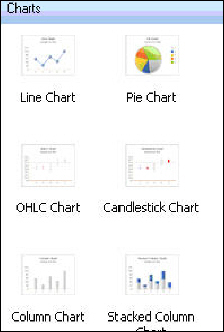
1. In the component panel, select the Charts tab.
2. Drag and drop the column chart into the design area and align it appropriately.
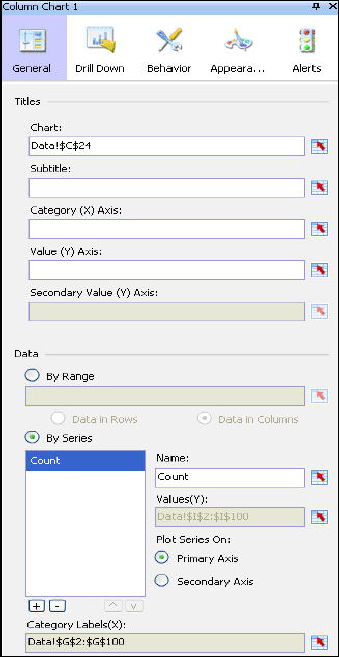
3. Select to the General tab of column chart’s property (located in the right pane).
4. Clear the subtitle.
5. Click the icon ![]() located at the right side of “Chart:” and select the C24 cell in the data sheet.
located at the right side of “Chart:” and select the C24 cell in the data sheet.
6. Highlight the cell C24 with the appropriate color and apply the following formula:
=CONCATENATE(C22, " Registration Count").
When the meeting is changed in the combo box, the caption of the bar chart would change appropriately.
Below is an example of sample data entered to show how the graph may look.
7. Click the “By Series” radio button in the properties pane.
8. Add a series by clicking the + button.
9. Enter the name as “Count” or enter any appropriate name.
10. Select the “Primary Axis” radio button.
11. Click the icon below the Values(Y): and select I2 to I100 from the data sheet.
12. Click the icon below the Category Labels(X): and select G2 to G100 from the data sheet. After making these settings, the property window would appear as shown below.
13. Select the Behavior tab and check In Series and In Values.

14. Select the Appearance > Layout tab and uncheck Show Chart Background.
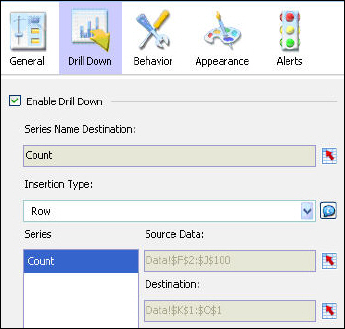
15. Select the Drill Down tab.
a. Check Enable Drill Down.
b. Select the Insertion type as Row.
c. Set the Source Data with the cell reference of F2 to J100 from the data sheet by clicking the icon.
d. Set the Destination with the cell reference of K1 to O1 by clicking the icon.
16. Avoid the drop-down list appearing behind the bar chart by right-clicking the combination box and click Bring to Front.
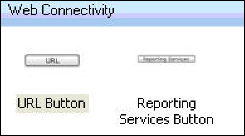
To add a report button component:
From the Web connectivity tab, drag and drop a URL button into the design area.
To setup the Data Manager Connection for the live data:
1. Enter the correct information in the cells colored  and DO NOT change any values in any cells colored .
For more details about these cells, refer to Excel Model.
2. Enter the two Webi reports names and the parameters as illustrated below.
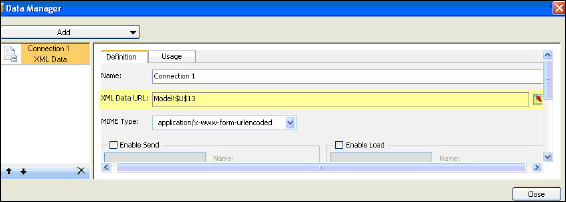
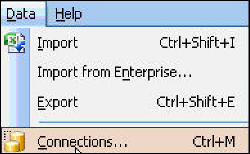
3. From the menu bar, select Data > Connections.
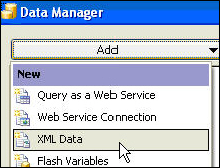
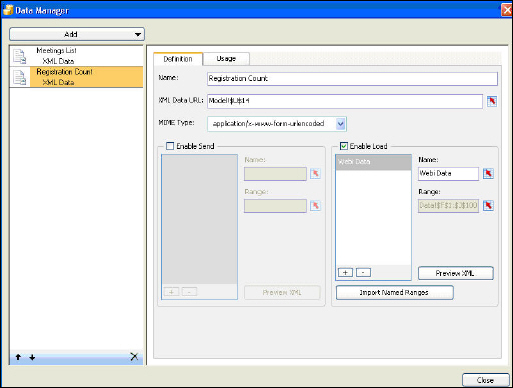
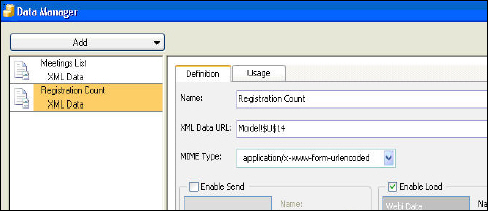
4. From the Add drop-down, select XML Data.
This adds an entry in the left pane of the Data Manager.
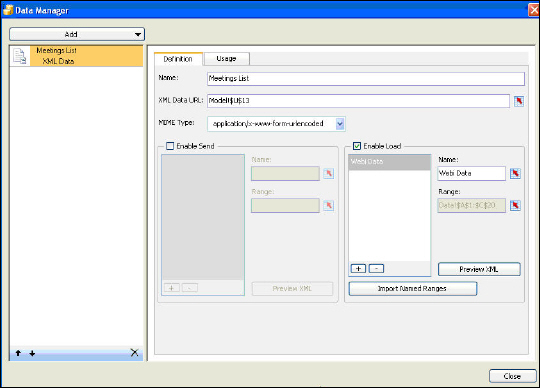
5. Select the Definition tab.
6. Enter any name of your choice in the name field.
For example, “Meetings List.”
7. Click the icon at the end of the “XML Data URL” and select the cell U13 from the Model tab.
8. Check Enable Load.
9. Click the + sign.
10. Replace the Range_0 label with “Webi Data”.
It is mandatory to set the label as “Webi Data” for XML Data connections you add.
11. Click the icon below the “Range.”
12. Select the range of cells in the data tab in the Excel sheet.
13. Select the range A1 to C20 in the data sheet.
We assume here that your report produces no more than 20 rows. If your report produces more than 20 rows, you may increase the number of rows in the selection you just made. By default, we reserved three columns because the reports produce three columns: Meeting ID, Meeting product Code, and Meeting Short Name.
14. Highlight the excel area A1 to C20 with yellow as represented in the legend tab.
This ensures where the data is placed when launching the dashboard.
15. Click the Usage tab and check Refresh on Load.
This triggers the report as soon as you launch the dashboard.
16. From the Add drop-down in the data manager, select XML Data.
17. Select the Definition tab.
18. Enter any name of your choice in the name field.
For example, “Registrant Count.”
19. Click the icon at the end of the “XML Data URL” and select the cell U14 from the Model tab.
20. Check Enable Load.
21. Click the + sign.
22. Replace the Range_0 label with “Webi Data.”
23. Click the icon below the “Range:” and select the range of cells in the data tab in the excel sheet.
For the example below, we selected the range of F1 to J100.
We assume here that your report produces no more than 100 rows. If your report produces more than 100 rows, you may increase the number of rows in the selection we just made.
By default, we reserved four columns due to the fact the reports produces four columns Sort Column, YYMmmWk, Quantity, Running Quantity and Invoice cut-off Date.
24. Highlight the Excel area F1 to J100 with yellow as represented in the legend tab.
This ensures where the data is placed when launching the dashboard.
25. Click the Usage tab and check Refresh on Load.
This triggers the report as soon as you launch the dashboard.
26. Navigate to the Data Manager and select the Registrant Count XML data connection.
27. Select the Usage tab.
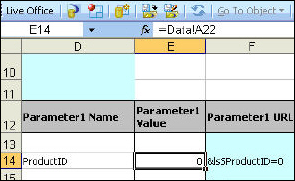
28. Click the icon at the end of the “Trigger Cell:” and point it to E14 of the model sheet. Essentially the report gets fired when the meeting value is changed.
29. Select When Value Changes.
30. Navigate to the Model Sheet, place the cursor in the cell E14 and reference it to cell A22 of Data sheet (for e.g. =Data!A22) , which has the filtered Meeting ID as shown below.
If the user clicks on a bar in the bar chart and clicks Report, it should produce a roster as of that week.
To set up a drill through a report:
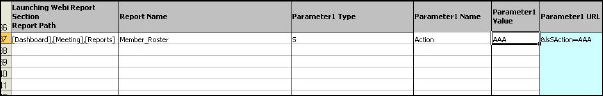
1. Navigate to the Launching Webi Report section and enter the following information as shown below:
a. Report Path = [Dashboard],[Meeting],[Reports]
b. Report Name = Sample_MTG_Registration_Roster
c. Parameter 1 Type = S
d. Parameter 1 Name = ProductID
e. Parameter 1 Value = =Data!A22

Meeting ID filters due to the selection from the combo drop down.
f. Parameter 2 Type = S
g. Parameter 2 Name = InvoiceDate
h. Parameter 2 Value = =Data!O1
Invoice Date filters by clicking the bar.
i. Complete URL = Completed http URL which is referenced by the URL button as shown below.
j. Select the General tab for the URL button and point it to cell U37 on the model sheet by clicking the icon as illustrated below.
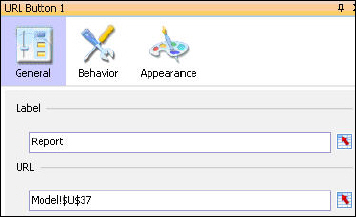
When you launch the dashboard, click on a bar, and click the report button, you receive the roster of the meeting registrants.
This section has not been implemented in this dashboard. You may refer this section if you wish to launch any Personify screens from the dashboard. This is applicable only if you are launching the dashboard from Personify.
For example you have listed the recent 5 registrants in this dashboard and assume you have stored the data in the Data Sheet L4 .. N9 region.
Assume when the user clicks a row, that particular row should filter and place in the region L11 .. N11.
To launch a Personify screen from the dashboard:
1. Place a URL button component in the dashboard and name the button appropriately.
2. Point the URL button component’s URL to N12 of the data sheet.
N12 will have the following formula =IF(Model!$B$1="Y","",CONCATENATE("cmd://Main/OpenView?Name=ORD001&Key=",L11)) to launch the Order Entry screen with the selected order information.
To preview the completed dashboard:
1. From the menu bar, click Preview.
This verifies the dashboard, the data, and the drill through report.
1. To have a quick start on building the dashboard you may refer to the tutorial by completing the following steps:
a. From the menu bar, select Help > Quick Start.
b. From the Quick Start pane, click Start.
2. You may refer to the samples to learn more about each component by completing the following steps:
a. From the menu bar, select File > Samples.
b. From the category box, click User Guide Samples.
c. Browse through the list of various samples provided in the Items box.
d. Select any of the samples and click OK to bring the sample into the designer window.
3. You may refer to high quality templates provided by Xcelsius by completing the following steps:
a. From the menu bar, select File > Samples.
b. Click any one of the items from the category box.
c. Browse through the list of various samples provided in the Items box.
d. Select any of the samples and click OK to bring the sample into the designer window.
4. You may change the complete look and feel of a dashboard by selecting the theme you desire.
To do so, click the Theme tool bar and select the desired theme.
5. You may select the appropriate color palette by clicking the color button from the tool bar.
6. To launch the dashboard from an external website (portal), complete the following steps:
a. Open the provided sample dashboard using the Xcelsius Designer Tool.
b. From the file menu, click File > Export > HTML.
It creates a Flash file and an HTML file.
c. Open the HTML file and edit the required flash variables, as shown below.
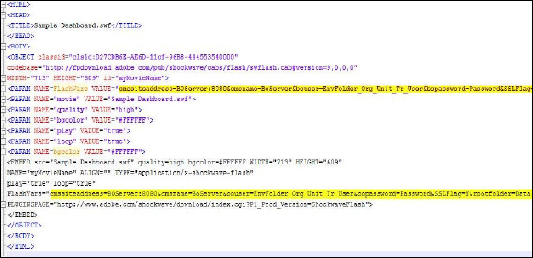
d. Save the file.